
Web 3.0 and Blockchain Market Trends 2025 Analysis Report

Executive Summary
The Web 3.0 blockchain market reached $4.62 billion to $7.23 billion in 2025 depending on measurement criteria, showing robust growth from previous years. Market projections indicate expansion to $42 billion by 2030 with compound annual growth rates ranging from 41% to 48%. North America maintains dominance with 35-41% market share, while institutional adoption accelerates across DeFi protocols, real-world asset tokenization, and Layer-2 scaling solutions.
DeFi total value locked hit record $237 billion in Q3 2025 driven by institutional stablecoin flows, despite daily active wallet participation declining 22%. Security remains a priority concern with $2.47 billion stolen in H1 2025 alone, already exceeding 2024 totals. Investment momentum continues with $3.8 billion raised in Q1 2025, representing 138% increase from Q4 2024.
Market Size and Growth Trajectory
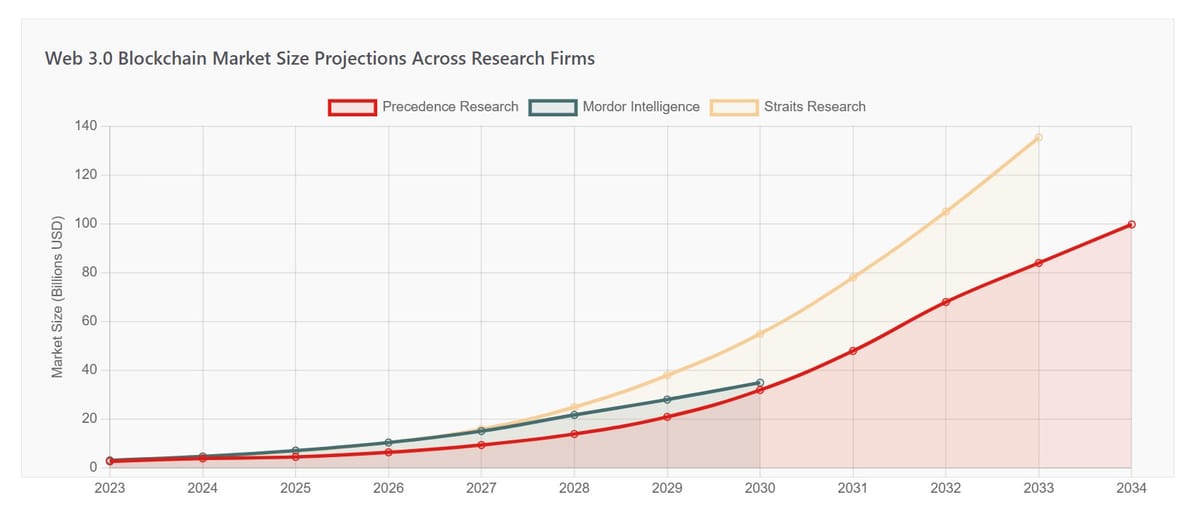
Data: Precedence Research, Mordor Intelligence, Straits Research, Research and Markets
Multiple research firms report the 2025 Web 3.0 blockchain market between $4.62 billion and $7.23 billion. Precedence Research values the market at $4.62 billion, while Mordor Intelligence places it at $7.23 billion. This variance stems from different methodologies in counting decentralized applications, infrastructure layers, and protocol classifications.
Growth projections remain consistently bullish across all sources. The market compound annual growth rate ranges from 41.18% to 48.2% through 2034. Straits Research predicts $135.34 billion by 2033, while Precedence Research forecasts $99.75 billion by 2034. These projections reflect increasing blockchain adoption in enterprise environments, accelerating DeFi integration, and expanding real-world asset tokenization.
Regional Distribution
North America captured 41.2% market share in 2025, driven by regulatory clarity initiatives and venture capital concentration. The region hosts major blockchain development hubs in San Francisco, New York, and Miami. Asia-Pacific shows fastest growth rate at 41.2% CAGR, with China, South Korea, and India leading adoption. Europe maintains steady growth supported by MiCA regulatory framework implementation.
DeFi Ecosystem Performance
Data: DappRadar, OnChain Standard, CertiK
DeFi protocols achieved record total value locked of $237 billion in Q3 2025, marking the highest TVL ever recorded. This represents 50% growth from $100 billion in Q1 2024. Institutional exposure to Bitcoin and stablecoins drove this expansion, alongside clearer regulatory frameworks enabling institutional participation.
Ethereum maintained leadership with $90-119 billion TVL, representing 55-60% market share. Solana positioned second with $13.8-25 billion TVL despite experiencing 33% decline in Q3. BNB Chain showed 15% quarterly growth reaching third position, attributed to new perpetual DEX launches.
Protocol Analysis
| Protocol | TVL (2025) | Primary Function | Key Development |
|---|---|---|---|
| Lido | $30 billion | Liquid Staking | Ethereum staking dominance |
| Aave | $20 billion | Lending Protocol | Multi-chain expansion |
| Uniswap | $15 billion | Decentralized Exchange | V4 launch with hooks |
| MakerDAO | $8+ billion | Stablecoin Issuer | RWA integration expansion |
| EigenLayer | $7+ billion | Restaking Protocol | Ethereum security sharing |
| Curve Finance | $6.5 billion | Stablecoin DEX | Stablecoin liquidity pools |
Data: DeFiLlama, Tangem, CryptoNinjas
Stablecoin inflows provided major catalyst for TVL growth, with approximately $46 billion flowing into DeFi protocols in Q3 2025. Real-world asset platforms like Centrifuge reached $1 billion TVL, while BlackRock BUIDL and Ethena USDtb each surpassed $1 billion, demonstrating institutional appetite for tokenized treasury products.
Investment and Funding Landscape
Data: InnMind, Crunchbase, CB Insights
Venture funding to Web3 startups rocketed to $3.8 billion across 220 deals in Q1 2025, representing 138% increase from Q4 2024 and doubling Q1 2024 figures. The surge reflects easing regulatory environment and renewed institutional confidence following Binance.US securing $2 billion round, the largest crypto investment on record.
AI-powered Web3 projects captured $1.8 billion in funding throughout 2024-2025, constituting 26% of total capital raised. Investment in AI-related blockchain startups surged 85% in 2024. SingularityNET raised $25 million to expand decentralized AI marketplace, while Fetch.ai secured $40 million from Outlier Ventures and Bosch Ventures.
Sector Investment Breakdown
| Sector | Funding Amount | Growth Rate | Notable Investments |
|---|---|---|---|
| AI-Powered Web3 | $1.8 billion | +85% YoY | SingularityNET, Fetch.ai |
| Layer-2 Solutions | $2.6 billion | +180% YoY | Celestia ($100M) |
| Blockchain Gaming | $2.5 billion | Strong interest | Arbitrum GCP ($190M) |
| RWA Tokenization | $2 billion | +150% YoY | Ondo Finance expansion |
| ReFi | $800 million | +220% YoY | Toucan Protocol, KlimaDAO |
| AI Agents | $1.39 billion | +9.4% YoY | Autonomous trading systems |
Data: InnMind Blog, Crunchbase
Notable Q1 2025 deals included Phantom wallet raising $150 million at $3 billion valuation from Paradigm and Sequoia Capital, and Flowdesk securing $91.8 million for crypto trading infrastructure. Regenerative finance saw 220% funding increase in 2024 with $800 million allocated to sustainability-focused protocols.
Security Landscape and Challenges
Data: CertiK, CCN, Hacken, Infosecurity Magazine
The cryptocurrency sector lost $2.47 billion to hacks and exploits in H1 2025, already surpassing the $2.42 billion stolen throughout 2024. CertiK documented 344 security incidents with average loss per incident reaching $7.18 million, substantially higher than 2024 average of $3.1 million.
Bybit suffered the largest crypto hack in history in February 2025, with North Korean state-sponsored Lazarus Group stealing $1.4-1.5 billion through exploited wallet signer vulnerability. This single incident accounted for nearly 60% of H1 2025 losses. Cetus Protocol experienced $225 million breach in May, though Sui validators successfully froze and returned $162 million.
Attack Vector Analysis
| Attack Type | Total Loss | Incidents | Primary Vulnerability |
|---|---|---|---|
| Wallet Compromise | $1.7 billion | 34 | Private key exposure |
| Phishing | $410 million | 132 | Social engineering |
| Access Control | $1.46+ billion | Multiple | Authentication failures |
| Smart Contract | $540+ million | Various | Unaudited code |
| Social Engineering | $400 million | Coinbase breach | Insider compromise |
Data: CertiK H1 2025 Report, Hacken Research
Access control failures represented 59% of total losses, with wallet compromise being costliest attack vector. Ethereum experienced highest number of incidents at 175 events totaling $1.63 billion losses, largely from Bybit hack. Bitcoin saw $373.6 million stolen across nine incidents in Q2 2025.
October 2025 showed improvement with 85% decline in crypto hacks compared to previous months, indicating strengthened security practices. Most major protocols now undergo third-party smart contract audits. Multi-signature wallets and hardware security modules became standard for exchanges and large protocols.
Emerging Technologies and Innovations
Data: L2Beat, Electric Capital, Developer Reports
Layer-2 Scaling Solutions
Layer-2 ecosystems received nearly 10% of all blockchain infrastructure funding in 2024. Funding into rollup ecosystems skyrocketed 180% year-over-year, with rollup-specific projects representing 20% of Layer-2 investments. Bitcoin Layer-2 solutions attracted $447 million in funding, with 39% arriving in first three quarters of 2024.
Leading Layer-2 networks include Arbitrum, Optimism, Base, Polygon, and newer entrants like Mantle Network. These solutions process thousands of transactions per second at fraction of mainnet costs. Ethereum Layer-1 handles approximately 15 transactions per second, while Layer-2 solutions achieve 4,000+ TPS at minimal fees.
Real-World Asset Tokenization
RWA tokenization reached $10 billion milestone in March 2025, growing 150% year-over-year. Major players include MakerDAO, BlackRock BUIDL, and Ethena USDtb, each managing over $1 billion TVL. This trend enables tokenization of traditionally illiquid assets including real estate, bonds, treasury bills, and commodities.
BlackRock BUIDL stablecoin backed by tokenized money-market fund shares showed fastest growth among RWA products. Institutional investors demonstrate preference for safer assets amid bearish crypto sentiment, with treasury bill yields outperforming major DeFi protocol returns.
Decentralized Physical Infrastructure Networks
DePIN sector reached $30 billion valuation in early 2025 with over 1,500 active projects. These networks incentivize deployment and operation of physical infrastructure through token rewards. Applications span wireless connectivity, cloud storage, energy grids, and sensor networks.
AI and Blockchain Convergence
Integration of artificial intelligence with blockchain creates new applications for decentralized data marketplaces, autonomous trading systems, and generative NFTs. Projects utilize on-chain machine learning for smart transactions, predictive pricing, and automated governance decisions. AI agents raised $1.39 billion in 2025, showing 9.4% increase over prior year.
DAO Ecosystem Development
Data: PatentPC, Coinlaw, DeepDAO
Over 13,000 DAOs established globally by 2025, collectively managing treasuries between $21.4 billion and $30 billion depending on measurement methodology. These organizations engage 11.1 million governance token holders. More than 6,000 DAOs exhibit regular activity through governance voting and operational participation.
Community DAOs constitute 62% of all active DAOs globally, with finance remaining top sector. Investment DAOs manage over $1.4 billion in diversified assets, while gaming DAOs like Yield Guild Games control $520 million in digital assets. Media and content DAOs represent 18% of ecosystem, enabling collaborative creation and revenue sharing. Organizations utilize various governance and operational tools to manage treasuries, voting mechanisms, and member coordination.
Treasury Management Challenges
Research reveals 81.67% of DAO treasury assets invested in native governance tokens, exposing organizations to market volatility. Uniswap DAO treasury holds $2.3 billion entirely in UNI tokens, creating 1:1 correlation with token price fluctuations. Compound maintains $172 million treasury with 94% held in COMP tokens.
| DAO | Treasury Size | Primary Sector | Key Achievement |
|---|---|---|---|
| Uniswap DAO | $2.3-3 billion | DeFi Exchange | Largest protocol treasury |
| Lido DAO | $1+ billion | Liquid Staking | Ethereum staking leader |
| Aave DAO | $1.3 billion | Lending Protocol | Multi-chain governance |
| MakerDAO | $800+ million | Stablecoin | RWA integration pioneer |
| Yield Guild Games | $520 million | Gaming | Play-to-earn ecosystem |
| Gitcoin DAO | $45+ million distributed | Public Goods | Open-source funding |
Data: DeepDAO, 101 Blockchains, DAO Analytics
Total DAO treasury values exceeded $40 billion in early 2025 when including all assets under management. Non-financial DAOs saw 25% increase year-over-year, with platforms like DAOhaus and Aragon reporting expansion. Asia-Pacific region leads DAO formation, driven by China, South Korea, and India. Sustainability-focused DAOs number 500-600 organizations globally. Those interested in exploring active decentralized organizations can review this comprehensive list of DAOs across different sectors and governance models.
Regulatory Environment and Compliance
Regulatory frameworks evolved throughout 2025 providing clearer operational guidelines. The United States passed GENIUS Act in July 2025, establishing federal framework for stablecoins requiring full 1:1 reserve backing, regular audits, and regulatory oversight. Implementation enforcement expected by Q3 2026.
Europe implemented MiCA regulations affecting blockchain businesses, fintech operations, and crypto native companies. The framework represents step toward high regulatory standards applied to nascent space. China introduced laws related to cryptocurrency and blockchain technology creating more conducive environment for controlled growth.
Sixty percent of global financial institutions exploring or adopting DeFi models in 2025, demonstrating mainstream acceptance. Stripe acquired crypto-wallet startup Privy for Web3 capabilities following $1.1 billion Bridge acquisition. ConsenSys purchased Web3Auth enhancing MetaMask with seed-phrase-free login and Bitcoin support.
User Engagement and Adoption Metrics
Daily unique active wallets averaged 18.7 million in Q3 2025, declining 22.4% from Q2. The decrease reflects reduced SocialFi and AI DApp usage despite DeFi liquidity increases. GameFi maintained strongest sector engagement with 4.66 million daily active wallets, representing largest share of Web3 interaction.
Non-custodial Web3 wallet adoption expected to climb 20-30% in H2 2025, building on 2024 momentum. Ethereum maintains developer leadership with 24,144 commits and approximately 1,572 developers, exceeding other blockchain networks. Solana tripled market share from 2.5% to 7.3% becoming second-largest blockchain by TVL.
DAO participation continues surge with governance token holders reaching 11.1 million globally. Traditional financial firms and enterprises increased Web3 footprint, particularly in tokenized securities, digital identity, and DeFi operations. The shift toward decentralized platforms driven by regulatory pressures and user preferences for data sovereignty.
Future Outlook and Projections
Web 3.0 blockchain market positioned for sustained growth through 2034 with conservative estimates reaching $42 billion by 2030 and optimistic projections exceeding $135 billion by 2033. Key growth drivers include institutional adoption acceleration, Layer-2 scaling maturity, cross-chain interoperability solutions, and real-world asset tokenization expansion.
Modular blockchains poised for breakout growth in consumer-facing applications by 2026. These specialized chains split consensus, execution, and data layers enabling higher performance and customization. Cross-chain bridges and LayerZero messaging protocols essential for cohesive Web3 ecosystem where users and assets move seamlessly across networks.
Decentralized identity solutions expected to become widespread by 2026 using zero-knowledge proof technology and biometric authentication through smartphones. Estonia e-Residency program demonstrates blockchain-based digital identity potential for secure government service access and cross-border transactions.
Environmental concerns drive proof-of-stake adoption and eco-friendly consensus mechanisms. Carbon credit tokenization through projects like Toucan Protocol and KlimaDAO aligns blockchain technology with ESG investment goals projected to reach $50 trillion by 2030.
Frequently Asked Questions
Sources and References
Market Research Firms: Precedence Research, Mordor Intelligence, Straits Research, Research and Markets, Grand View Insights, SkyQuest Technology, Market Research Future, The Business Research Company
DeFi Analytics: DeFiLlama, DappRadar, DefiPulse, OnChain Standard, Tangem, CryptoNinjas, Dune Analytics
Security Research: CertiK Hack3d Report, CCN Crypto Security, Hacken Research, Infosecurity Magazine, Bitget News, Digital Watch Observatory
Investment Data: InnMind Blog, Crunchbase Web3 Tracker, CB Insights, PitchBook, Messari, OpenVC
DAO Analytics: PatentPC, Coinlaw, DeepDAO, DAOhaus, Aragon, 101 Blockchains
Industry Reports: Electric Capital Developer Report, L2Beat, Statista DeFi Statistics, Gartner Blockchain Forecasts, SNS Insider Market Analysis
News Sources: Cointelegraph, CoinDesk, Medium (NEFTURE Security, DeFi Planet), The Fintech Times, Bittime, Blaize Tech Blog
Blockchain Platforms: Web3 Foundation, Ethereum Foundation, Solana Labs, Polygon Technology, Arbitrum Foundation